How to find marker genes in cell clusters
New method facilitates identification of cell-type specific genes in single-cell data
The thousands of cells in a biological sample are all different and can be analyzed individually, cell by cell. Based on their gene activity, they can be sorted into clusters. But which genes are particularly characteristic of a given cluster, i.e. what are its “marker genes”? A new statistical method called Association Plot facilitates the determination and analysis of these marker genes.

Unsplash
Which genes are specific for a certain cell type, i.e. “mark” their identity? With the increasing size of datasets nowadays, answering this question is often challenging. Often, marker genes are simply genes that have been found in specific cell populations. However, many more genes could be characteristic of a particular cell type but remain undiscovered.
“Association Plots (APL)”, a new statistical method for visualizing gene activity within a cell cluster makes it easier to find its marker genes. The plots compare the activity of genes of a given cluster with all other clusters from the data set. Additionally, they make it easy to see which genes are shared with other clusters.
“Association Plots not only allow us to identify new marker genes. It also works the other way around – we are able to match clusters of unknown identity in a dataset to cell types, based on a provided list of marker genes,” says Elzbieta Gralinska of the Max Planck Institute for Molecular Genetics in Berlin.
The biotechnologist works in the team of Martin Vingron, which developed the technique, demonstrated its functionality on two publicly available datasets, and published the results in the Journal of Molecular Biology. Moreover, APL has been released as a free module for the statistical environment R. The APL package allows researchers to visually inspect their single-cell data and select individual genes with the cursor to learn more in-depth details.
Analyzing and grouping single cells
Why is it necessary to identify marker genes in the first place? Modern sequencing technologies are able to decipher individual RNA molecules in individual cells. From a blood sample, for example, each cell can be separated and a sample of the cell’s RNAs can be decoded. These single-cell data represent the active genes that were transcribed into RNA molecules.
The advantage: Instead of puzzling over which cell type a particular RNA belongs to, it can be traced back to its cell of origin. The disadvantage: sequencing thousands of RNAs in every single cell out of tens of thousands of cells produces extraordinary amounts of data.
One way out is to sort the cells based on their RNA content. “Single-cell data are composed of a wild mix of many different cell types. We are interested in cells of the same cell type, which should all behave similarly,” explains Martin Vingron. Hence, it makes sense to group similar cells computationally, he says. “For us, the marker genes define a cell type.”
Explore cell clusters interactively
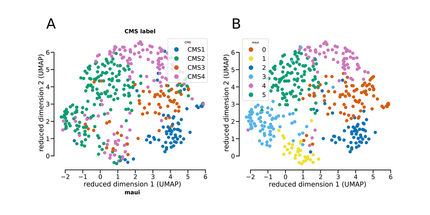
Using publicly available data from white blood cells, the team demonstrated how the new algorithm works. The many different types of white blood cells like T-cells, B-cells, or monocytes are all grouped in separate clusters. The researchers confirmed known marker genes and were able to show that close relatives among the blood cells also share great similarity in their gene activity.
“Each of the marker genes we found with APL could have been discovered by at least one other existing method for identification of marker genes,” Gralinska says. But the advantage of APL over the existing algorithms is its graphical representation of the results, she says. “Existing tools provide long lists of genes and score values. Oftentimes, users go through the list and stop at an arbitrary cut-off,” Gralinska says.
In contrast, the new method provides a way to visualize these genes, click on each one and take a closer look at its activity, she says. “We're not just providing lists of marker genes, we're allowing users to review how these genes behave,” the researcher says. “With Association Plots, they can dive into their data to learn more about each cell type.” Plus, she says, it's very easy to break down the biological role of the most interesting genes in a subsequent step via Gene Ontology terms enrichment analysis, which is compatible with the APL software – something she considers “a very useful feature.”
The underlying mathematical model
The high-dimensional data that contain information on activity across genes cannot be represented visually without loss of information. The same is true for clustered data, all of which complicates analysis. “Our trick is that we take into account many more than just two or three dimensions, but ultimately create a two-dimensional diagram,” Gralinska says.
The Association Plots are derived from a mathematical technique that simultaneously embeds both genes and cells in a common, high-dimensional space. Measuring the distances between genes and a given cell cluster in this space results in pairs of values that reflect the association of a gene to a given cluster and give insights into its association to other clusters.
“One shortcoming of APL is that we rely on pre-clustered data, which means we have to rely on other techniques for clustering,” says Martin Vingron. “Nevertheless, we hope that our new method will find many new users. We find that a visual and interactive process simply makes a better analysis.”
Original publication
Other news from the department science
Most read news
More news from our other portals
See the theme worlds for related content
Topic World Cell Analysis
Cell analyse advanced method allows us to explore and understand cells in their many facets. From single cell analysis to flow cytometry and imaging technology, cell analysis provides us with valuable insights into the structure, function and interaction of cells. Whether in medicine, biological research or pharmacology, cell analysis is revolutionizing our understanding of disease, development and treatment options.


